
What We Built This Sprint
This development cycle focused on three pillars: fixing broken copilot modules ported from SOCFortress, unifying the chat experience into a single intelligent assistant, and hardening the assist mode for enterprise reliability. Every change was validated with automated Playwright visual QA across all 32 pages.
Super Agent: AI-Powered Command Center
The Super Agent is the heart of AgentiX Cyber — a full-page conversational AI interface with MCP (Model Context Protocol) integration for real-time access to Wazuh, TheHive, Cortex, Velociraptor, and more. It supports multiple LLM backends including local Ollama models and cloud providers.
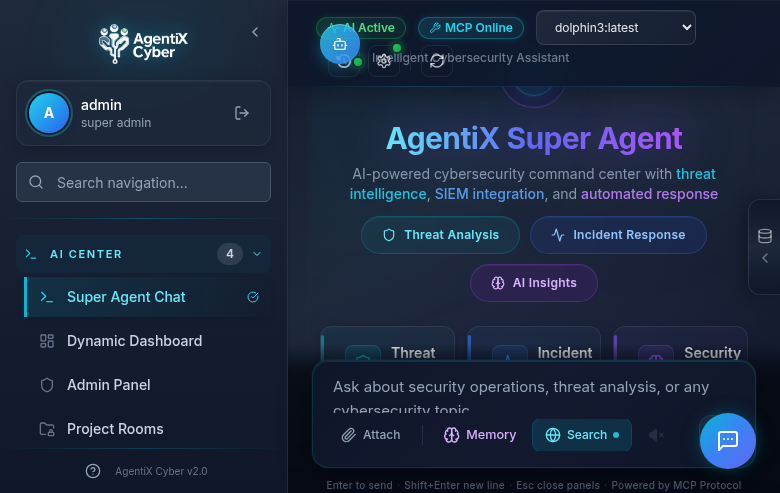
Unified Floating Assistant
We merged the separate Chat and Assist modes into a single intelligent assistant that auto-detects user intent. No more manual toggle — type a question and it routes to the AI chat; type a UI command like “Go to SIEM Alerts” and it activates the assist agent to navigate and interact with the platform autonomously.
→
Intent Classifier
→
Chat (MCP Query)
|
Assist (DOM Agent)
→
Response / Action
The intent classifier uses regex-based pattern matching to detect navigation, click, type, and scroll intents. Phrases like “go to”, “navigate to”, “click on”, and “show me the” trigger the assist agent, while everything else flows to the Super Agent chat with full MCP tool access.
SOC Operations Modules
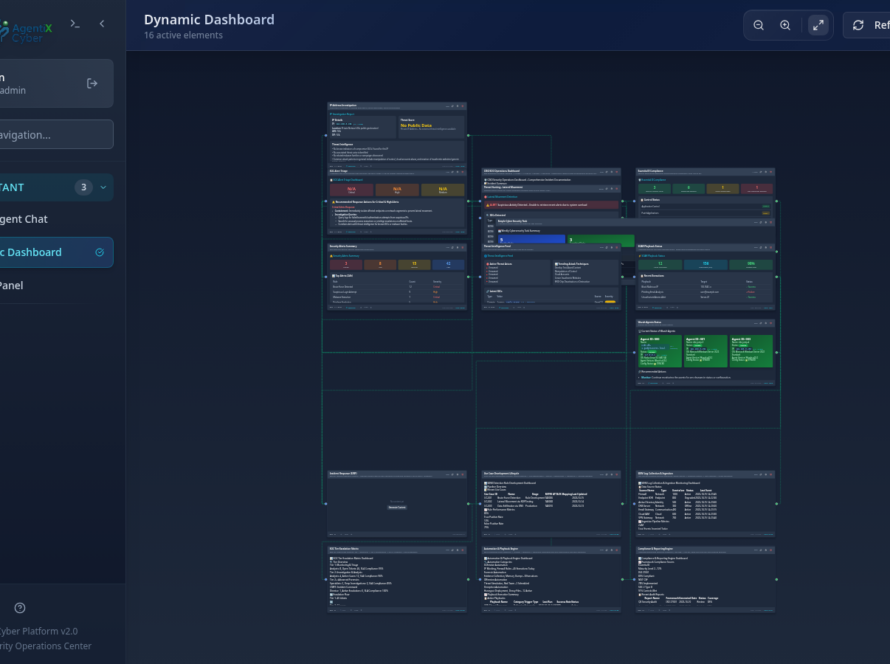
The platform now includes 32 fully functional pages organized into logical groups: AI Center, Intelligence, Detection, Investigation, Response, Compliance, and Administration. Here are the highlights.
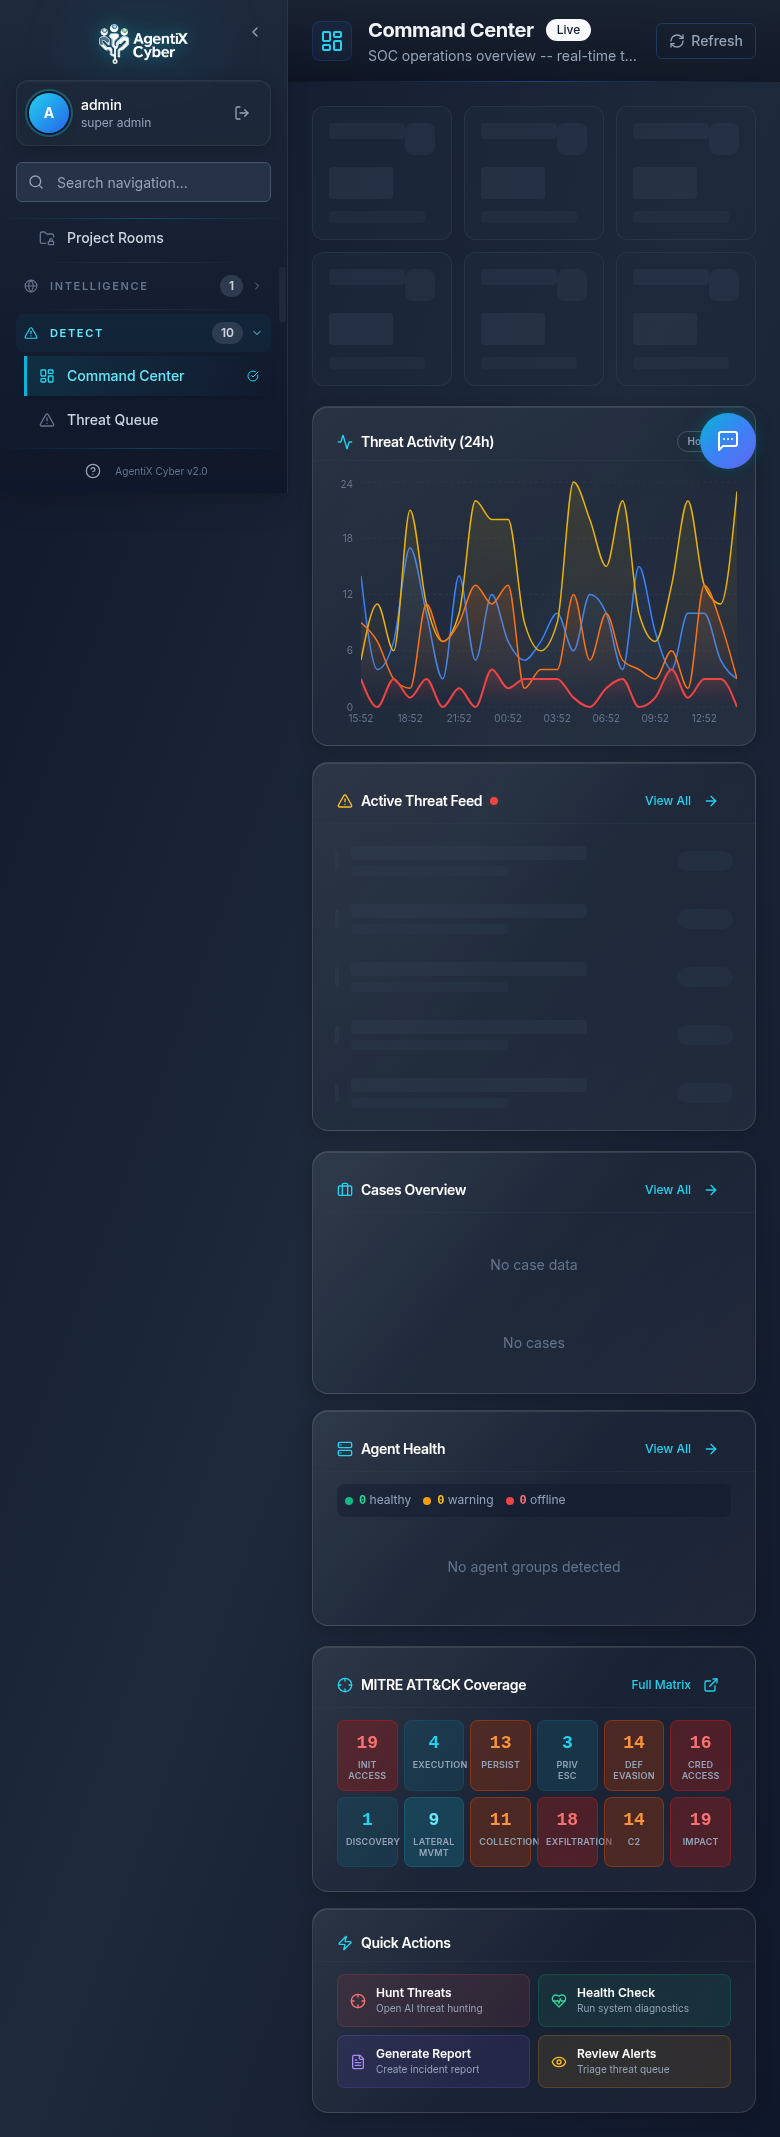
Command Center
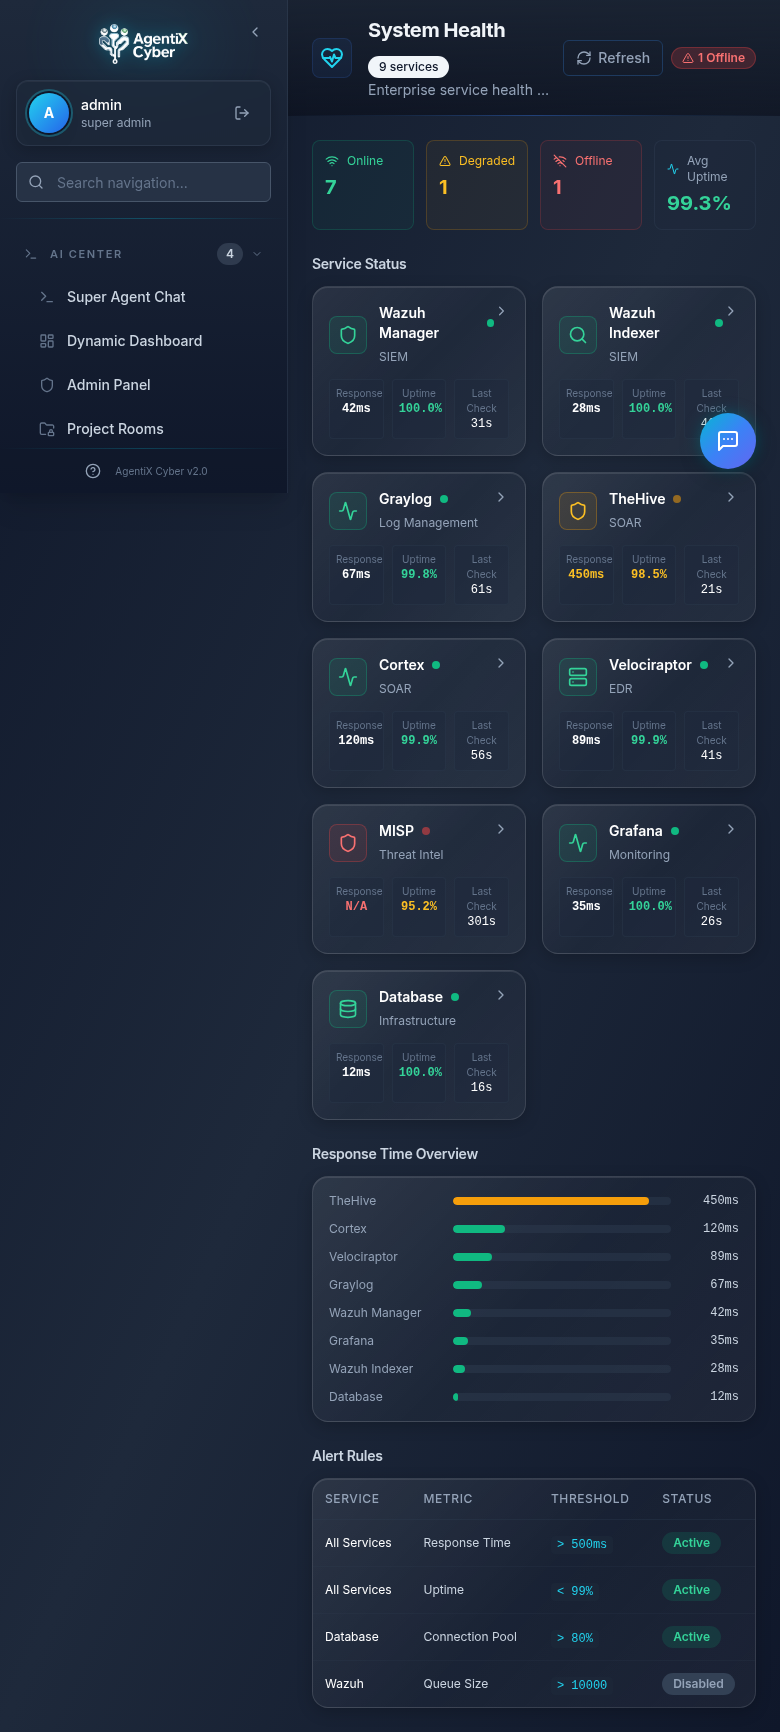
The real-time SOC operations overview with live threat activity charts, active threat feed, cases overview, agent health monitoring, MITRE ATT&CK coverage heatmap, and quick action buttons for common SOC workflows.
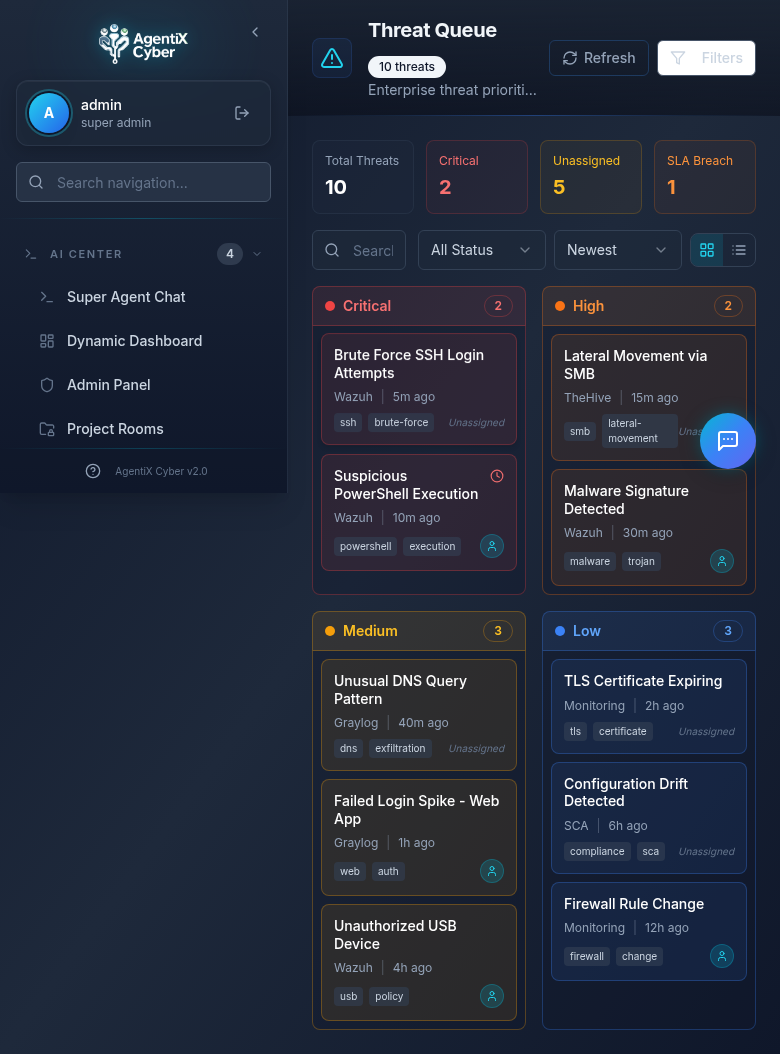
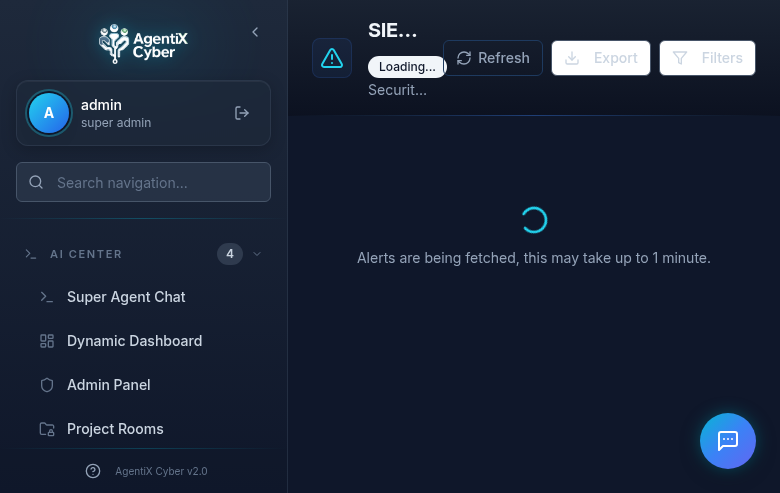
Threat Queue & SIEM Alerts
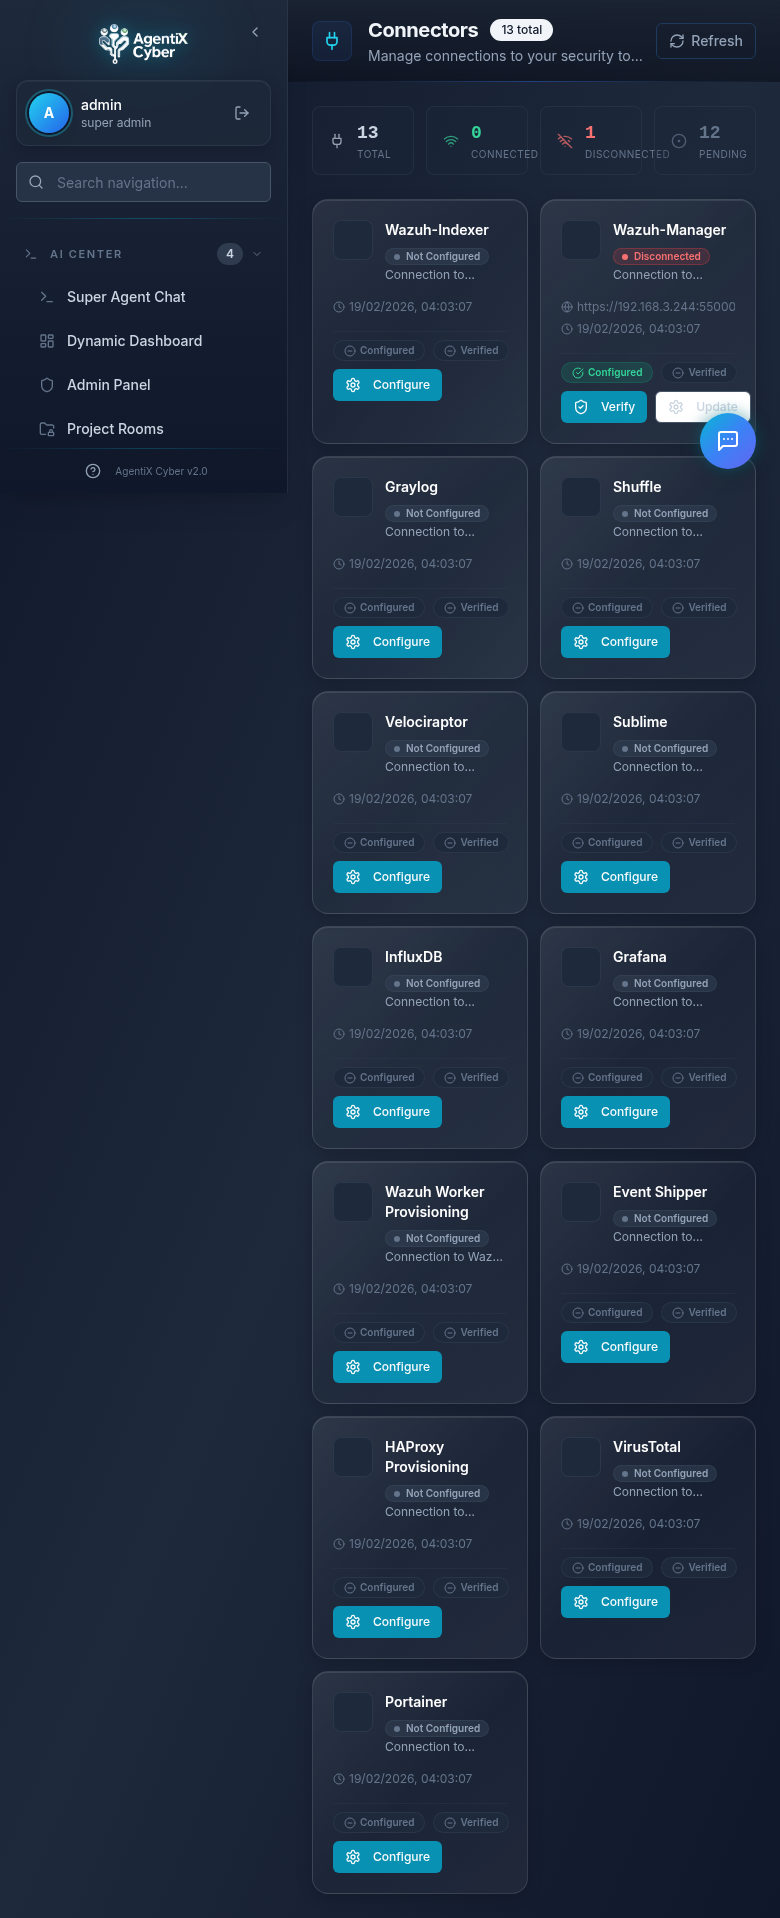
Security Integrations
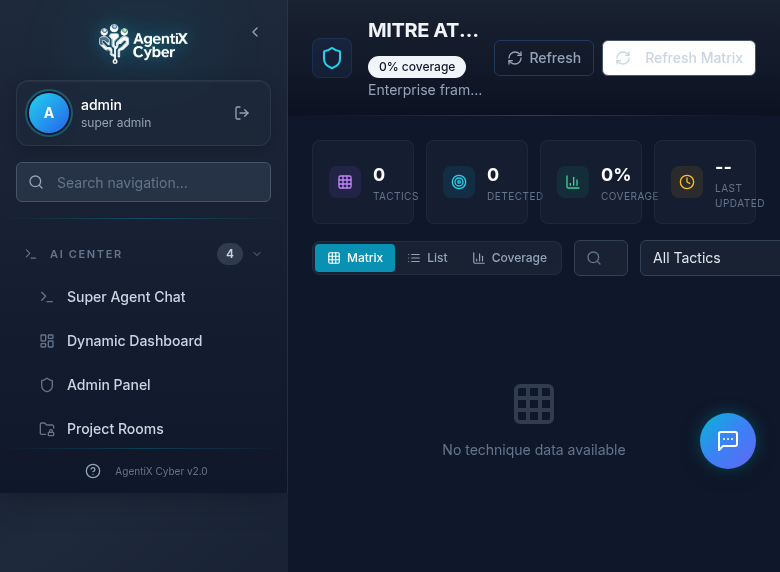
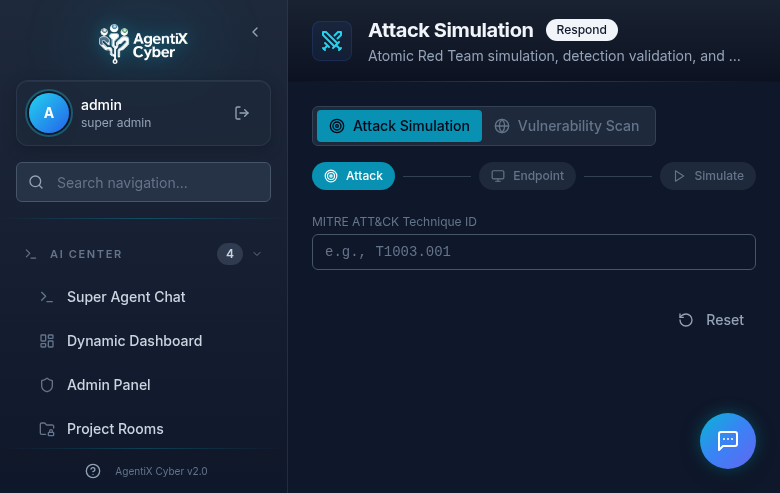
MITRE ATT&CK & Attack Simulation
Assist Mode: Enterprise-Grade UI Automation
The assist agent can navigate the platform, click buttons, fill forms, and read page content — all autonomously. This sprint brought major reliability improvements:
SPA-Friendly Navigation
Three-strategy approach: sidebar link click, pushState with popstate, then full reload as last resort. No more unnecessary page refreshes.
Retry with Fallback
Every action retries up to 3 times with 500ms delays. Element resolution uses a 5-strategy fallback chain from CSS selectors to fuzzy text matching.
Complete Route Map
The LLM now knows all 28 navigation routes. Previously only 13 were documented, causing “page not found” failures for half the platform.
MutationObserver Waits
Replaced fixed sleep delays with reactive MutationObserver-based DOM settle detection. Actions proceed as soon as the page stabilizes, not after arbitrary timeouts.
→
LLM Analysis
→
Action Plan
→
Execute + Retry
→
Validate Effect
→
Next Step
Automated Visual QA
Every page is validated using Playwright-driven visual regression testing. The test suite navigates to each of the 32 pages, takes full-page screenshots, and verifies that no page crashes, shows infinite spinners, or displays broken layouts.
Quality gate: TypeScript strict mode with zero errors, Vite build verification, and Playwright screenshot comparison across desktop (1440×900), tablet (768×1024), and mobile (375×812) viewports. All 32 pages pass with no crash states or layout regressions.
Pages Fixed This Sprint
Five SOCFortress copilot modules were broken after porting — displaying infinite loading spinners or crash screens due to missing API integrations. Each was rebuilt with proper error handling and graceful degradation:
- SIEM Alerts — Rewired to Wazuh Indexer with real API calls, timeout handling, and export functionality
- Artifacts & Evidence — Rebuilt artifact viewer with proper error states when Wazuh is disconnected
- Graylog Management — 6-tab interface (Inputs, Streams, Indices, Messages, Alerts, Events) with graceful connection error handling
- Graylog Metrics — Real-time metrics dashboard with fallback to “connection unavailable” state
- Graylog Pipelines — Pipeline viewer with proper empty state when no pipelines configured
All 28 Navigation Routes
Dashboard
Command Center
Threat Queue
SIEM Alerts
Agents List
Agent Groups
Sysmon Config
Detection Rules
CiBRAI Actions
Vuln Overview
SCA Overview
MITRE ATT&CK
Artifacts
Log Search
Cases
Reports
Attack Simulation
Connectors
Graylog Mgmt
Graylog Metrics
Graylog Pipelines
Incident Sources
Customers
Healthcheck
Sigma Rules
Activity Logs
Admin Panel
Next: Live MCP Tool Execution
The next sprint focuses on connecting live Wazuh, Graylog, and TheHive instances to populate dashboards with real security data, and enabling the Super Agent to execute MCP tools in production workflows.